Mapping RVA: Where you live makes all the difference
Through August 23, 2014, the Library of Virginia will host Mapping RVA: Where You Live Makes All the Difference, a traveling exhibition focused on charts, maps, housing, economics, inequality, and poverty.
The multimedia exhibition of nine maps created by Brian Koziol, director of research and consulting services at Housing Opportunities Made Equal of Virginia, Inc. (HOME), uses geographic information systems to show the unique history of the Richmond metropolitan area. The maps examine the connection between public policy and economic development in the Richmond region through a fair housing lens. Also on display will be historic maps from the Library’s collections that highlight the evolution of the city’s neighbor-hoods and the role that policy makers have played in shaping neighborhood demographics.
If you want to lose a couple of hours, dive into the full report from 2012 here (PDF). Below are some of the highlights (but you really should read the report to get the full context behind each of the charts/maps).
The exhibit runs until August 23rd. The Library of Virginia is located at 800 E. Broad Street and is open Monday – Saturday from 9:00 AM – 5:00 PM.
— ∮∮∮ —
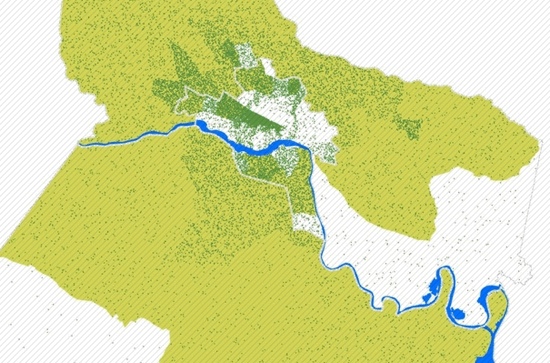
White flight, 1960 – 2010

— ∮∮∮ —

— ∮∮∮ —
— ∮∮∮ —

— ∮∮∮ —
— ∮∮∮ —

-
Recommend this
on Facebook -

Report an error
-

Subscribe to our
Weekly Digest

Ross Catrow
Founder and publisher of RVANews.

Notice: Comments that are not conducive to an interesting and thoughtful conversation may be removed at the editor’s discretion.
This exhibit is amazingly informative and well put together!! I definitely recommend checking it out!
Please check out the LVA’s online exhibit featuring HOME maps and historical maps form the 19th and 20th centuries at http://www.virginiamemory.com/online-exhibitions/exhibits/show/mapping-inequality. Thanks!
Something bothers me about this infographic being labeled “white flight” … I mean I agree that it is suburban sprawl for sure. BUT the 75% percent bothers me. 75% of the united states is white, so the numbers you see fleeing to the suburbs in the infographic are entirely consistent with the idea that EVERYONE (all races) fled to the suburbs except for those who could not afford to. Plenty of middle and upper class BLACK families fled to Chesterfield County as well. Check out the demographics of the USA from 1910 to present… it is 75% white until 2010. –> https://sceneonerichmond.files.wordpress.com/2014/06/2014-0623-usa-racial-demographics.jpg
@RVAFuture – thanks for your thoughtful observation. However, I think you may have misinterpreted the data. The chart shows not where 75% of the [entire] population was white, but rather where 75% <> actually lived. So one sees that in 1960, the dots (representing 15 whites) are pretty well clustered around downtown RVA, but in subsequent decades, the dots thin out close to the city and increase in density to the south and the west.
(sorry – apparently formatting in my earlier post caused some of it to be deleted) @RVAFuture – thanks for your thoughtful observation. However, I think you may have misinterpreted the data. The chart shows not where 75% of the [entire] population was white, but rather where 75% OF ALL THE WHITE PEOPLE actually lived. So one sees that in 1960, the dots (representing 15 whites) are pretty well clustered around downtown RVA, but in subsequent decades, the dots thin out close to the city and increase in density to the south and the west.
I don’t understand, why is important to put white flight in this information, are the poverty or opportunities status in the RVA based on where whites are?