EDU FAQ #006: What would school closings really have meant?
Now that school closure discussions are off the table, let’s think through the repercussions of shelving that solution so quickly.
“…shuttering schools nearly always sets off a torrent of political backlash, as authorities in Chicago, Philadelphia, and other urban districts have learned in recent years. And for understandable reasons: schools are integral parts of communities; they’re built into families’ routines and expectations, and closing them inevitably causes pain and sadness, even when it’s what’s best for students” (Churchill & Petrilli, 2015)
The city battle to close the RPS budget gap rages on. Just like with our own bank accounts, when the money isn’t there, we have to limit or cut spending. Proposals have been put forth and the public outcry over the potential closing of several schools was heard across the city, with packed School Board and City Council meetings, as well as yard signage all over the city and billboards popping up along the interstate proclaiming, “Support Our Schools.”
Now that City Council has passed the amendments to partially fund schools and the School Board has tabled discussions of school closures this budget cycle, Superintendent Dana Bedden, with the help of retired Assistant Superintendent of Financial Services Ralph Westbay and Assistant Superintendent for Support Services Thomas Kranz, analyzed the budget to determine where cuts will have to be made and presented them to the School Board on May 16th. According to Westbay, “the School Board has the unenviable task of trying to squeeze $4.9 million of teacher salary decompression, $6.2 million of structural deficiencies, $2.3 million for year two of the AIP, and $2.8 million of other initiatives into $5.5 million.”
For starters, closures should not be proposed solely for fiscal reasons.1 If RPS decided that closures were necessary, they should have shown unequivocally from the start that all other options had been explored, that all other viable options would have been detrimental to students (such as cutting services or staff), and that the decision to close would be in the best interest of students and learning (research should show that decisions were made based on best practices). This should have been paired with a substantial long term plan for supporting students and families through the transition. What we saw was the opposite: a knee-jerk reaction to budget cuts that lacked a long term vision for the district and the students who would be affected. At least, that’s the public perception.
The decision to close schools is now off the the table, and major cuts to services are proposed, including special education services and AP offerings. I’m going to cover those next, once the School Board has finalized what exactly those cuts will be. Even though closures are off the table for this budget cycle, they will likely be back. They were always part of the 15-year Option 5 recommendation from the Facilities Task Force that was adopted by the School Board. Before the time comes and schools start shuttering, we should fully understand the potential impacts of such a decision.
The major concerns of parents were wide-ranging, everything from the effect on academic achievement to safety. Others worried about the impact losing a community school would have on a neighborhood. Others still have rightfully decried the further segregation of schools that already sit near or at apartheid settings. Teachers at the proposed closures were worried about their job security and those at schools set to absorb students worried about class sizes and overcrowding–all valid concerns that should have been addressed by RPS and the School Board before they moved forward with any motion, including the tabling that occurred on May 16th.
RPS failed to show their community stakeholders that closures were in the best interest of the students and families for whom they serve.
As I started to dig, I found there isn’t much research about the impacts of school closures on urban districts, although it is growing. Across the nation, the phenomenon of closing urban schools has grown in the last 15 years, adding Richmond to the other 70 large and mid-sized cities closing school doors across the country (Jack & Sludden, 2013). Since 2005, Richmond has closed 17 schools, eliminated 1 million square feet of space and 6,681 open seats. Even so, the district as a whole remains at 81.25% of functional capacity during the 2014-2015 school year. The last RPS school closing–Clark Springs Elementary–took place during 2013, ended up further segregating the affected schools, Cary and Fox, and proved a difficult time for the families affected. Adria Scharf, an RPS parent, said, “Many of us lived through rushed end-of-year school closures a few years ago, and it was terrible. It was traumatic for the children who were affected, and for many parents. Some parents I know simply up and moved out of Richmond in part because of that experience.”
The lessons of the past and the concerns voiced by stakeholders should have been fully addressed to show that any closure would have been done with forethought and planning so that structures and supports would be in place to ensure the least disruption and most success for students. This could have created buy-in from the community, instead of a blanket decision to propose closures that created unrest and push back. RPS failed to show their community stakeholders that closures were in the best interest of the students and families for whom they serve. Maybe this is what they wanted so that the proposal would ultimately be shut down by the Board due to parental pressure.
It’s worth asking though, what would have been the potential effects for students and schools if the consolidation discussions had been allowed to move forward? Or what could be the effects in the future, if and when they do move forward with right sizing the district? There’s a lot of conjecture floating around–some holds water and some doesn’t.
FALSE: Bigger schools mean more discipline issues
I don’t know a single person who wants to send their kid to a school they think is unsafe. Perceptions about school safety are usually based on raw data from VDOE Report Cards, media sensationalization about specific incidents, and word of mouth from other families who may…or may not…send their kids to a specific school. All are problematic.
VDOE Report Card data is self-reported by schools. While RPS has a standardized Codes of Responsible Ethics (PDF), ultimately, building staff make final decisions about the individual course of action for each infraction. Ideally, these would be aligned to the Code’s Levels of Interventions and Consequences. This isn’t always the case. With all of this said, the available data is far more appropriate for use in making decisions than solely basing opinions off of any media report or rumor that has the potential to come from a place of unconscious biases or false information.
To try and understand the district wide discipline landscape, I first used Suspension & Expulsion in Virginia School Divisions 2013-14 School Year by Jason Langberg from the Legal Aid Justice Center’s JustChildren Program. I reached out to Langberg as well for more updated information on the state of RPS discipline. This data can be heady so here is a bulleted list to make it slightly easier to consume and less discouraging…maybe.
- In 2013-2014, RPS led the state in number of short-term suspensions and came in sixth when looking at rate per 1000 students.
- In 2013-2014, RPS had the third highest number of long-term suspensions and ranked number one in rate per 1000 students.
- From 2013-14 to 2014-15, the number of RPS students long-term suspended increased by over 75%.
- In 2014-2015, Martin Luther King, Jr. Middle School long-term suspended 71 students, which was more than all but nine Virginia school divisions.
- RPS had 1.87% of the Commonwealth’s public school students but issued 16.80% of all long-term suspensions.
- The district also has the highest risk difference in the state for White students. Black students were 76.1% of the total student population in RCPS, but were issued 93.4% of short-term suspensions, 98.0% of long-term suspensions, and 97.4% of expulsions.
This data shows there is certainly an underlying discipline crisis in RPS. When you compare this to the VDOE Report Card data, for the most part, it seems discipline issues are isolated to certain schools, with six elementary schools accounting for 70% of referrals and 12 making up 89% of all referrals.2 The other half of the elementary schools account for a mere 11% of all discipline issues for RPS.
Some schools are also suspending a large percentage of their students. Langberg’s data reported that Swansboro suspended 17.1% of its students; Fairfield Court suspended 26.6% of its students; and Woodville suspended 30.1% of its students. At the high school level, Wythe made up 54% of the referrals by itself, while three schools (Wythe, Armstrong and Huguenot) made up 84%.
So, what does all this mean for RPS? One of the concerns we heard was that bigger schools meant more discipline issues. With a crisis already boiling in RPS, the last thing any stakeholder wants to see is a further increase in discipline issues for RPS.
Therefore, I researched the effect of school size on instances of discipline.3 What I found does not support the claim that discipline rates increase with school size. Educators and students perceive an increase in safety issues (Bakioglu & Geyin, 2009), and frequency may rise because there are more students. But the rate (when you account for the increase of students) of bullying, threats, and physical violence not only didn’t rise, but were in fact, lower in larger schools (Gottfredson, 1985; Klein & Cornell, 2010). The more likely factors that attribute to increased incidents are “administrative problems, such as breakdown in communication, inadequate feedback about performance, and lack of staff involvement in decision-making” (Gottfredson, 1985). Additionally, studies found that it’s not school size but class size, specifically teacher to student ratio, that had an impact on discipline and acts of violence (Gottfredson, 2015).
TRUE: Overcrowding lowers achievement
Research shows the negative impacts of overcrowding on student learning and achievement, especially for our highest need kids (Rivera-Batiz & Marti, 1995). This concern is related to, but not the same as, school size issues. This is a building capacity issue. Schools become overcrowded when their enrollment exceeds the amount of students the building was designed to serve. If we go back to EDU FAQ #005, I talked about the capacity reasons for closing schools. RPS has stated that their ideal goal is all schools at 85% to 90% of functional capacity. This chart from the task force’s report (PDF) shows the student-teacher ratios from which capacity numbers are created based on the number of classroom spaces in each building.
| Grade | RPS Functional | RPS Maximum |
|---|---|---|
| PK | 15:1 | 18:1 |
| K | 18:1 | 24:1 |
| 1 – 12 | 22:1 | 25:1 |
| EE | 9:1 | 9:1 |
There is no School-Board-mandated percent at which a school is considered overcrowded, therefore we used the administration’s own target and assume any building over RPS Functional Capacity is considered “overcrowded.” From this, three Northside and six Southside elementary schools are overcrowded, none of which are affected by the closures.
Of the four elementaries named to absorb students from closures, Blackwell, Redd, and Fisher could all potentially be pushed into “overcrowded” status depending on enrollments for the following school year. As for high schools, only Huguenot is over 85% of functional capacity. Like last time, assuming an unrealistic straight split of students from Armstrong distributed to the three other high schools, none would be pushed over 100% functional capacity, but Marshall could come really close.
Virginia Department of Education ratios are higher than state ratios, but still aligned with best practice in regards to impact on student learning and class size. RPS class sizes reflect the district’s recognition of the unique needs of their student body and an attempt to keep their classes sizes below state maximums.4
| Grade | State Maximum |
|---|---|
| K | 24:1 |
| 1 – 3 | 24:1 |
| 4 – 6 | 25:1 |
| 6 – 12 (English) | 24:1 |
| Secondary | 21:1 |
Secondary includes middle and high school. The ratio is a bit different. It is a school-wide ratio of teachers to average daily attendance. In other words, if there are 210 students in a building, they need 10 full time teachers. This does not mean classes are that small.
If we push our definition of overcrowding to the VDOE state maximums (shown above) only two elementaries and no high schools are over 85%.
So are RPS buildings really overcrowded?
A couple factors to consider. First, if RPS schools were properly staffed, meaning they had enough teachers and aides, teachers wouldn’t feel as stressed by the possibility of adding more students due to consolidations. When there aren’t enough teachers in a building, class sizes grow, squeezing more kids into rooms with less adults. These bigger class make teaching extremely hard. Shucks, we have ratios for a reason.
For secondary teachers, their loads can grow from 100 kids (five classes at 20 kids each) to 150 (five classes of 30 kids each). Sadly, I’ve seen it grow even more than that. Frankly put, this is overwhelming for teachers and does a disservice to the kids. Students lose the one-on-one interactions, achievement declines, and students fall through the cracks. This isn’t the fault of the teacher. They are working their tails off to help every kid. There simply isn’t enough time when class sizes grow. These bigger classes feel like overcrowding because even though the building may not be overcrowded, that classroom sure is. What RPS failed to articulate clearly was whether teachers would move with students during the consolidations. Although teachers normally consolidate to new schools with students, this isn’t always the case.
Second, building leadership needs to figure out how to properly create master schedules. When schedules are made poorly, one class may have 35 students and another has 15. Again, this leads to teacher perceptions of overcrowdedness.
Lastly, what feels like overcrowding is at least partially a building issue. What I mean is, the VDOE has guidelines (PDF) for public school facilities in Virginia, and these include the minimum square footage of classrooms. The feeling of overcrowdedness certainly has to do with the current classroom sizes in these very, very old school buildings that simply aren’t up to the square footage needs of 2016.
The VDOE guidelines state that an elementary classroom needs to be 975 sq ft. A teacher at Fisher Elementary measured several classrooms for me. Her numbers are estimates because she only had her small tape measure, but the kindergarten, first and second grade rooms were about 20 feet by 26 feet. The third and fourth grade rooms were about 23 feet by 29 feet. That is 520 sq ft and 667 sq ft, respectively, and well below state guidelines for classroom size.
And there, friends, lies a big issue that no one is talking about. While yes, schools may be under current capacity numbers determined by number of classrooms, actual space has seemingly not been considered. Teachers are squeezing a large number of children into a very small space. It isn’t about finding the classrooms, it is literally about not having the space–the square footage–to house more children. Can we fit more kids in these rooms? Sure. Should we? No.
TRUE: Poor conditions impact student learning
Research has shown that the effects of poorly maintained buildings can lead to lowered achievement (Holmes, 2012; Tanner, 2008), less engagement (Branham, 2004), and increased behavior issues (Bishop, 2009), as well as lower attendance and higher dropouts (Earthman, 1995). In one study, achievement increased when students were moved from an older building to a newer building, suggesting that school facilities do have an effect on academic achievement (Lumpkin, 2013).
Deferred maintenance has left many RPS schools in need of major, multi-million dollar renovations. Knowing that building conditions can have a significant impact on student outcomes, it’s disappointing to know that Richmond City has historically and recently placed so little emphasis on maintaining its buildings and ensuring that students have a healthy and safe building to learn in. For the most part, students in neighboring districts and more affluent schools are certainly not subject to such abject conditions.
How bad is it? We went into this a bit in EDU FAQ #005, but here is a quick refresher.
There are two places we can look to better understand the physical state of our schools. The Capital Improvement Plan lists the essential repairs necessary for safety and health. The three elementary schools proposed for closure have nearly $3 million dollars combined in needed repairs, of which Cary accounts for $1.5 million. These needed repairs include electrical, HVAC, roofing, and plumbing. Armstrong has nearly $2.9 million in needed CIP repairs.
The full Facilities Task Force report included everything from essential items to aesthetic upgrades, including windows, flooring, and lighting, all of which are necessary to bring old buildings up to base levels. The task force assigned four ratings to buildings, including complete renovation/replacement, major renovations, moderate renovations, or minor renovations. Remember that Cary only needs minor renovations plus an addition, while both Swansboro and Southampton need complete renovation/replacement. Armstrong only needs moderate renovations compared to the other three high schools that all need major repairs, but Armstrong is in Henrico, so money spent on an RPS building would be best spent on a building whose property taxes benefit the city.
City Council only approved $4 million of the requested $39 million in CIP funds. RPS is going to have to triage these needs and figure out where the bandages can be placed and where they can continue to defer. A group of parents and concerned community members are currently working to crowdsource funding to pay for repairs. It will be interesting to see how that works out. Organizations like HandsOn Greater Richmond have worked with major corporations to fund some minor repairs and aesthetic upgrades in RPS schools, but funding major health and safety repairs is a new and Herculean feat.
DEPENDS: Closures decrease student achievement
There is research to suggest enrollment has a stronger effect on learning for students from low-socioeconomic backgrounds and high concentrations of minority students (Gershenson & Langbein, 2015; Lee & Smith, 1997; Leithwood, & Jantzi, 2009). Therefore, if RPS had consolidated schools and increased enrollment numbers, achievement could have been impacted. Stated differently, schools with predominantly minority students and students from low-socioeconomic backgrounds have higher achievement in schools with lower enrollments. The optimal size is hard to peg, but based on what I’ve read, it appears to be somewhere between 600 and 900 students for secondary schools and slightly lower for elementary students. Yet, enrollment is only one very small piece. To truly understand what is happening in RPS schools, one must look at all of the potential variables: teacher quality, teacher retention, trauma, school resources, leadership…and the list goes on…
There is also body of research that shows when schools do close, displaced students fare better academically and show greater achievement gains when they move to higher quality schools, defined as having higher achievement results (Carlson & Lavertu, 2015; Research for Action, 2013). On the other hand, there is additional research that shuttering a low-performing school and sending kids to a higher performing school alone is not enough and only “imitates an inevitably continuous pattern of academically harmful displacement for children already disadvantaged” (American Federation of Teachers, 2012).
In this regard, there is no real consensus. This may be why when, in our interview, I asked Bedden, Kranz, and Westbay about the impact of achievement on their decision, Bedden said it was not taken into consideration. Although, when you look at the proposed closures, every single closing school is moving students to a higher achieving school. No way that can be a coincidence. Right? I only wish RPS would have acknowledged the potential benefits of this kind of move and used the available research to support their long term plan. Because, acting in the best interests of children shouldn’t be something we shy away from talking about even in the face of external pressure.
FALSE: Closing community schools destroys neighborhoods
One of the main objections to consolidation is the loss of neighborhood schools. It has been argued that with these closures would come a mass exodus of families to the county or to private schools. It is true that schools are an important determinant when selecting housing. For those invested in public schooling, this may mean moving to a neighborhood or district that is perceived as having excellent educational opportunities. For others, this means opting for private schools.
Specifically, affluent families benefit from opportunities to “buy in” to better school districts (Siegel-Hawley, 2013), otherwise known as housing identity privilege, or “a historically supported system of advantages in America that is based on how much house one can afford, and it is correlated directly with the degree of educational choices one can afford”(Gooden & Thompson Dorsey, 2014, p. 771). In other words, not everyone has the ability to move to neighborhoods deemed to have “good” schools or opt for private education. Those of lower socioeconomic status are priced out of neighborhoods perceived as having the best schools. These designations of “good” and “best” are linked to areas with more wealth, which translates to more property taxes benefiting schools.
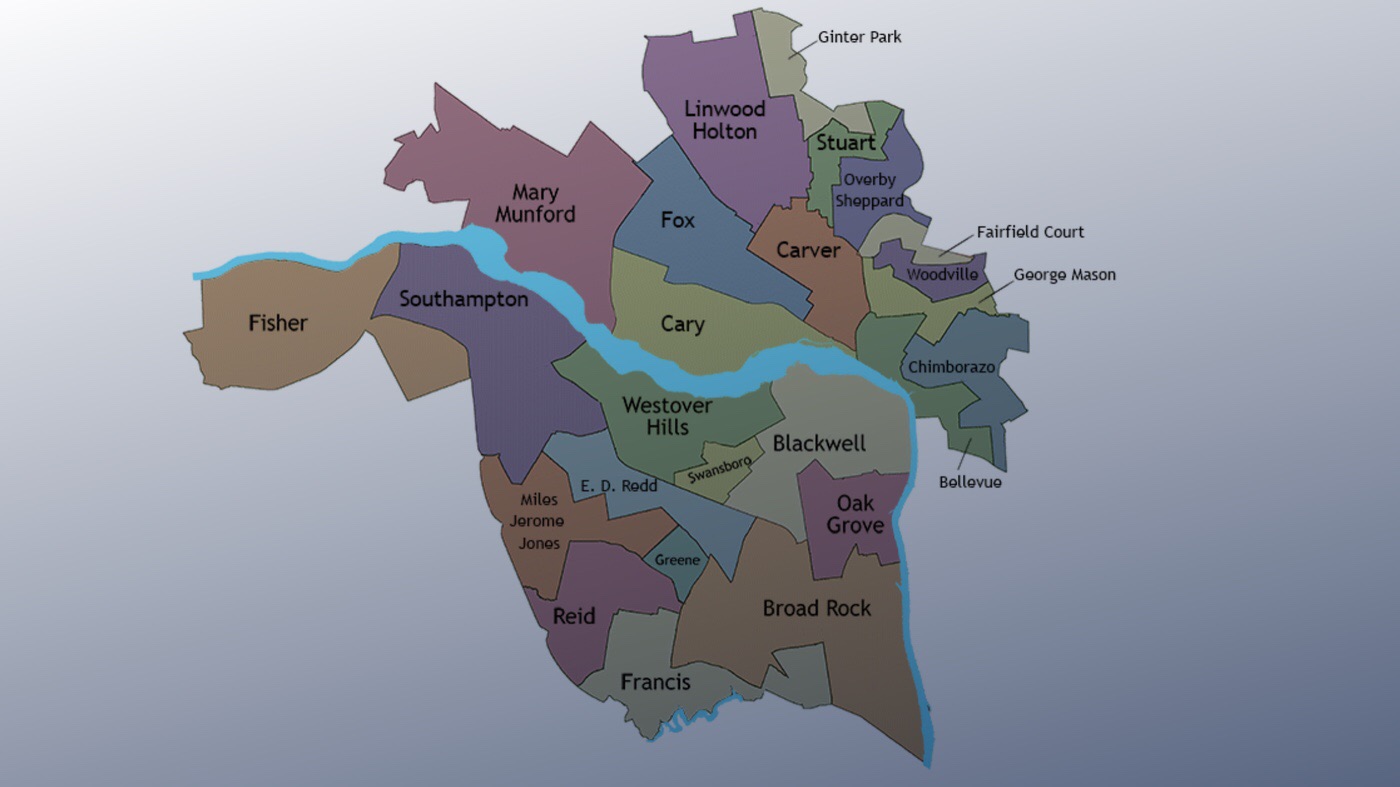
Research also shows that “the racial composition of schools’ student bodies plays a salient role in parents’ selection of the most appropriate school, particularly among white parents,” (Billingham and Hunt, 2016, p. 111) and White parents continue to choose schools with low African American student bodies. This privilege is reserved for those with means and leads to greater segregation among race and class lines in neighborhoods and schools. For instance, in the Mary Munford district, approximately 75% of students attend private school despite Munford having the highest enrollment of white students in the district (Siegel-Hawley, 2014) and the lowest concentration of poverty.
Post Brown vs. Board of Education, de facto segregation continued due to White flight from cities and persists today in the form of neighborhood and school choice. In a study of Richmond Public Schools, Genevieve Siegel-Hawley (2014) stated, “…supporters of neighborhood schools touted the benefits of making schools the center of community life–including closer links between surrounding residents and the school, increased parental engagement, and resource sharing. Yet research has not necessarily born out these assumptions.” She goes on to say, that one of the major themes emerging from her research is “that black and white families displayed clear preferences for schools in low poverty, predominantly white neighborhoods. This runs counter to the widespread notion that all groups prefer neighborhood schools (Armor 1996). Instead, the open enrollment policy has normalized and even made desirable the use of non-neighborhood schools.” This type of school choice has led to significant increases in school segregation in Richmond due to the way that white and/or affluent parents have used the system to their advantage.
TRUE: Segregation would persist (without rezoning)
The city proper and the surrounding region are increasingly diverse, and yet we have seen a continued increase in segregated schools5. Had a consolidation of schools without rezoning taken place, these effects could have multiplied, taking us even further back. According to Siegel-Hawley’s report Race, Choice and Richmond Public Schools: New Possibilities and Ongoing Challenges for Diversity in Urban Districts (2014), “the district’s accommodationist approach to school choice has been linked to the overrepresentation of white students in various schools.”
The current segregation trends in RPS are concerning, to say the least. In this regard, I could lay out all the statistics about school demographics, or I could show you a chart. OK, two charts, but two charts that speak louder than any words ever could.6 Keep in mind as you look at these that in RPS, White students account for approximately 9.44% of the population this school year.
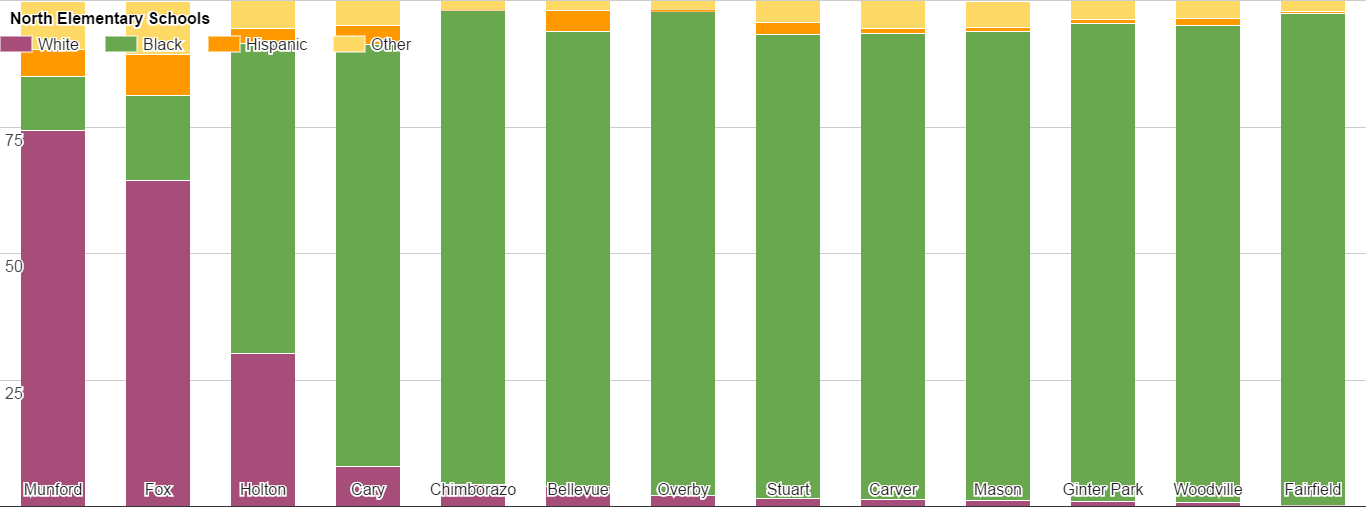
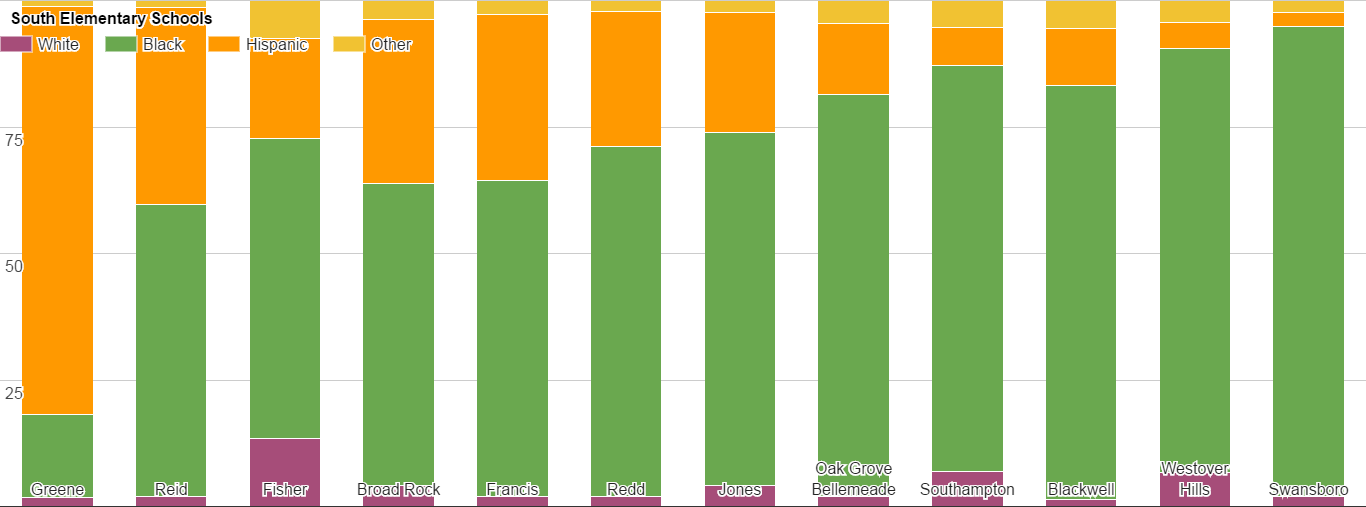
What this shows is a segregation of elementary schools by race, with certain schools catering to White and affluent families (possibly in hopes of drawing them into district schools.) If we fast forward to middle school, the small percentage of White families who were in the public schools have largely fled. Some appear to come back for high school, but only at select schools.
In Richmond, the most recent closing of Clark Springs is a prime example of the way rezoning has impacted school demographics. In a 2013 report Increasing Diversity in City Schools: Unexplored Paths of Opportunity, one chart showed that during the 2013 consolidation and consequent rezoning, lines were redrawn in such a way as to shift the racial demographics of some schools. Prior to the closing of Clark Springs, the Cary district was just over 61% White. After, it dropped to 16%. The Fox district, on the other hand, slightly increased to 77% White in 2013. Other district saw similar results, such as Westover Hills, which increased from 25% White to 56% White, while Blackwell decreased from 25% to 0%. Richmond does not have a great, or even moderately good, track record of rezoning and equitably integrating their schools.
How would this time have been any different? All of the schools that would have been affected by consolidations are predominantly (over 85%) students of color, again showing RPS’ and the School Board’s unwillingness to touch certain schools.
Where the schools differ is in their socioeconomic status. Districts use free and reduced lunch as an indicator of poverty concentration. The district’s student population qualifying for free or reduced lunch is about 75% as of September 2015. Three of the schools have higher concentrations of economically disadvantaged students (Swansboro, Blackwell, and Carver), one is at the district average (Redd), and three are below (Southampton, Fisher, and Cary).
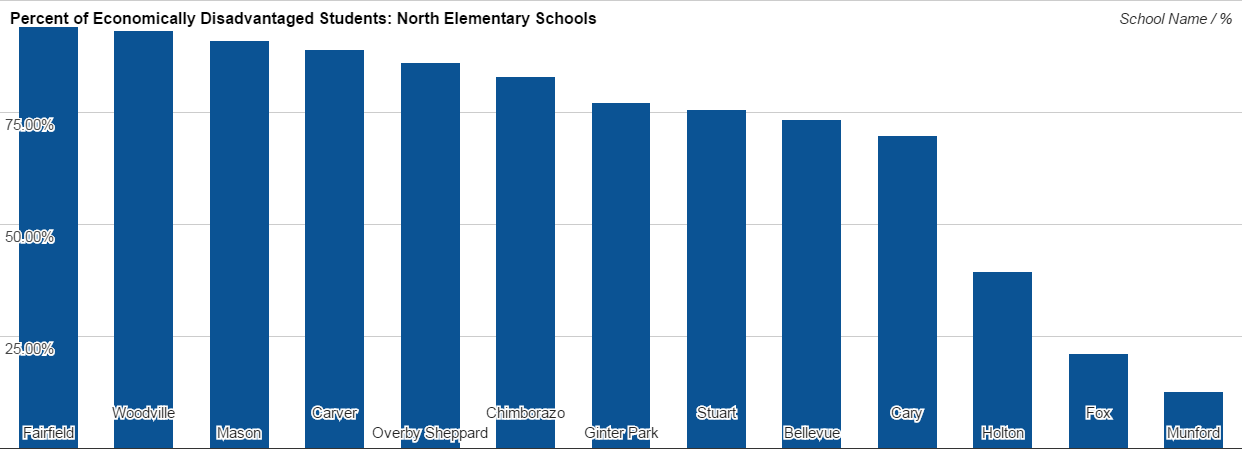
Closing Cary without rezoning would have moved students to a school that already has a higher percent of economically disadvantaged students, consolidating poverty and racial segregation at Carver while maintaining the disproportionately low poverty concentration at Fox and Munford.
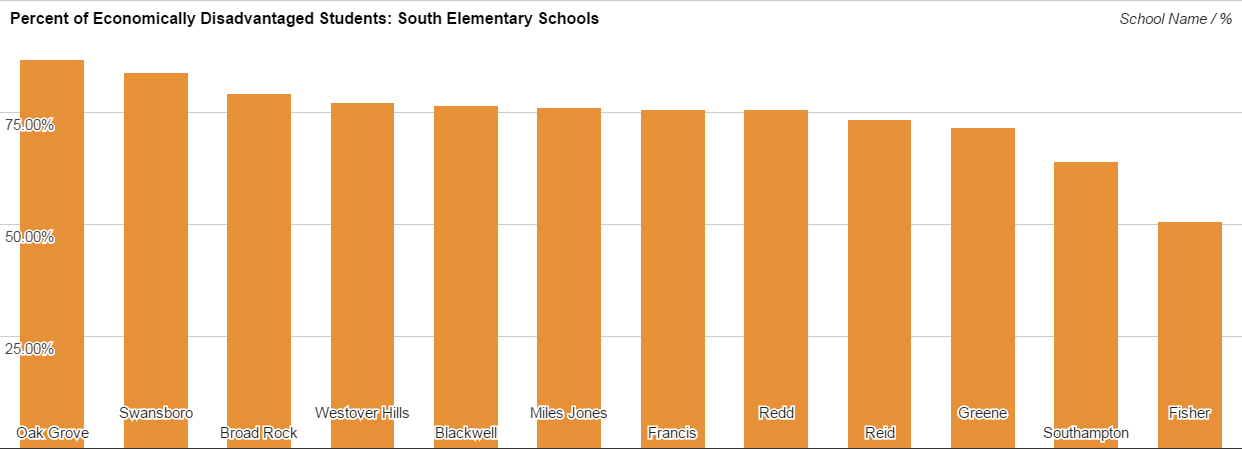
Splitting Southampton would have sent some students to Redd, which has a higher concentration of poverty, and Fisher, which has a lower concentration of students in poverty. Either way, this would have increased the percent of economically disadvantaged students at both schools. Likewise, moving Swansboro students would have further consolidated poverty at Blackwell.
Parents have decried the failure of RPS to include a rezoning of districts affected, specifically families from Cary who would be bussed around Fox to get to Carver. They aren’t wrong.
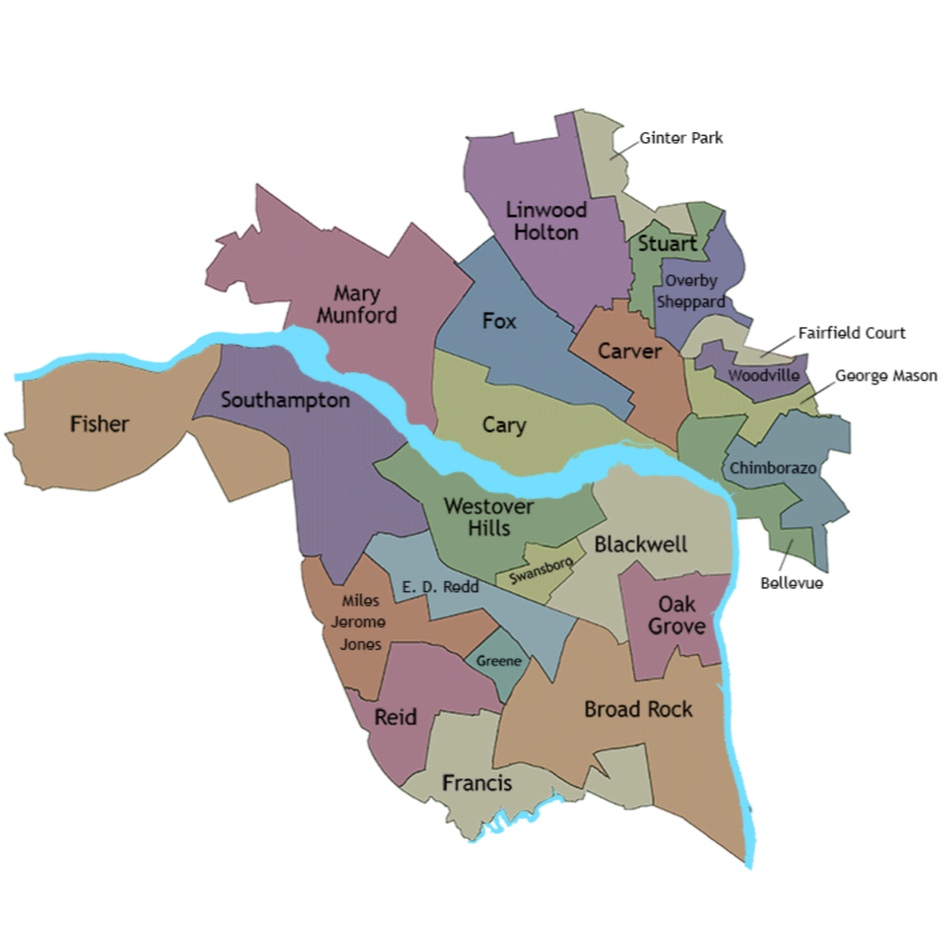
As noted previously, though, only the school board has the legal power to rezone. A rezoning would be best to ease the overcrowding of Fox, which sits at 110% of functional capacity while both nearby Cary (60%) and Carver (61%) are well below. Two other nearby schools, Holton and Munford are also over functional capacity. Any rezoning should rework the boundaries for those five schools (as well as other Northside schools) to equalize capacity issues and create less segregated schools. As we saw above, Cary and Carver are predominately African-American schools with high poverty, while Fox and Munford are predominately White schools with very low poverty that disproportionately affects Black students. Holton is predominately African American, but has the third largest White population in RPS.7
I’m not sure Richmond has ever seen a School Board willing to make that kind of change in the face of the political storm that would erupt from White and affluent parents zoned for Fox, Munford, and Holton. In a school district where only 9.44% of the school population is White, the school board decisions around rezoning have been influenced to preserve these three schools which are disproportionately White. This is the city’s perpetuation of a disgraceful legacy of racial and socioeconomic segregation borne of the refusal of parents and Boards to integrate schools equitably. We need a School Board willing to do the right thing and we need white and affluent parents who aren’t scared of integration. Too often, parents equate integration with “sacrificing” their child, despite the evidence to suggest that white children benefit from integrated schools.8
Until we have a school board willing to take desegregation on head first, this continued gerrymandering alone is reason enough to hold off on any consolidation that hasn’t been fully planned and supported to equitably serve all students in the district…not just those with the privilege and means to advocate loudest.
Note: I’ve used a lot of references in this work because I wanted to make sure everything was supported with evidence instead of being the opinions of just one lady hanging out on her couch writing things about education. I realize there is also conflicting evidence out there for many of these opinions. Data is funny that way. I’ve tried to choose research about Richmond when possible. In other areas, I’ve done my best to provide the most recent and commonly accepted research-based understandings with the knowledge that there may have been a different theory previously and that this too may change someday. Instead of boring you with the list of references here, if you want the full citations, go to the EDU FAQ page on my blog.
- I know that the closures were not originally proposed solely to close the budget gap. With this most recent roll out of named schools though, the perception is budgetary limitations expedited the potential for closures and was behind the selection of these specific schools. ↩
- There are 25 elementary schools in RPS. ↩
- And because I fancy myself someone who doesn’t believe in plagiarism (I am an English teacher after all…), I’m including those pesky in-text citations below because the ideas aren’t mine and I don’t like getting in trouble. ↩
- From Guidance Regarding Maximum Class Size and Student-Teacher Ratios in the Standards of Quality(PDF) ↩
- Not just segregation by race, but double segregation, meaning that people of color and those in poverty overlap in specific areas of the city and therefore, specific schools. ↩
- Data from the VDOE Fall Enrollment Data ↩
- Munford and Fox are well below the district average for economically disadvantaged students. Only 12.5% of Munford and 20.7% of Fox students are considered economically disadvantaged. Yet, their African American population is disproportionately disadvantaged. Munford is only 10.8% Black, but 51% of their economically disadvantaged students are Black. Fox similarity is 16.9% Black, but 55.8% of their economically disadvantaged students are Black. ↩
- NPR ran a piece recently on this. ↩
-
Recommend this
on Facebook -

Report an error
-

Subscribe to our
Weekly Digest

Teresa Cole
Teresa Cole teaches English to middle schoolers, loves to talk about all the education things and is committed to equity in public education.

Notice: Comments that are not conducive to an interesting and thoughtful conversation may be removed at the editor’s discretion.
Great information Mrs. Cole. We need a School Board willing to make the tough decisions.
Other cities are able to fund and take better care of their old school buildings. Other cities are doing historic renovation, energy conservation, even putting solar on re-done roofs. While I appreciate the information here, it does not change the overall problem- a leadership that makes neoliberal economic development and corporate welfare a bigger priority than our public schools. The City has invested more money in private development and “public-private partnerships” while ignoring renovation needs in our own school buildings. City leaders keep talking about a return on investment for these expenditures that never materializes. That needs to change NOW. Schools before stadiums.
Thank you for this thoughtful piece. Well researched and useful. I did some research a couple years ago about behavior referrals and consequences in RPS and surrounding counties. I found that schools with a more equitable distribution of race ethnicity also had higher proportion of suspension and expulsion for students of color. I also found that the SOL scores for schools with the highest scores in the city at the time also had the highest suspension rates. I will be teaching at Cary next year. I am looking forward to the experience. Perhaps we should connect to collaborate and talk about the future of Richmond’s children.
John – There is certainly research to support the disproportionate number of students of color who are suspended/expelled and it makes sense that this would be more visible in highly diverse schools. In a school that is 98% black, you don’t have the other populations to create disproportionately.
I haven’t seen the data about high scores/high suspension rates. I worked at an RPS schools that at the time was second for suspension, but had the lowest scores. Can you link some of the research you are referring to? I can also be contacted via email at teresa.a.cole@gmail.com
We need to get serious about the schools. That means paying attention to the School Board elections, getting people like Kim Gray unto City Council, and not electing anyone associated with the old regime to mayor.
So the author teaches in middle schools… but let me guess, not in the city? This whole series feels like it’s written by an outsider too afraid to actually invest and make change. It’s easy to observe and throw stones when you have no skin in the game. Stop criticizing the parents and the school board and tell us what you’re actually doing to make a change. You criticize white parents, but you’re white (judging by the picture)- do you have kids? Where are you putting them in school? Lead by example. Give some suggestions for making change. Then maybe these articles could be useful to the children of this city.
As Scott says above, this article doesn’t change the overall problem.
We have a child and live in Westover Hills district. We aren’t rich by any means but can’t in good conscience send our child to RPS. We we zoned Blackwell but apparently not a single child from our little district sent their kids there so they zoned us to Westover Hills in an attempt to capture more middle class kids. The author seems to suggest “the fix” is to merely make the 2.5 successful elementary schools more like the rest of the failing schools. If you tinker with M/F/H those parents, who whe largely responsible for its success, will just leave. Then you’ll have a uniform failure as opposed to a very bright lights. Point is what’s going on at M/F/H isn’t causing the rest of the schools to fail and that’s what we need to focus on. How do we fix the majority African American schools that comprise most of the district? Everything else is a red herring.
Jeff – I thought long and hard about whether I wanted to even dignify your comment with a response. I wavered and decided it would best to address you and just get it out of the way.
The argument people always like to bring up is that if I don’t work in RPS or have kids in RPS, then I can’t possibly understand the system or the educational challenges that RPS has, therefore I should “stay out of it.” People who don’t like or agree with the results of research default to ad hominem. Your and other’s attack on my credentials is a weak, at best, attempt to negate any argument or research I have done on this topic. The reality is, that whether you or others like it, research is more valuable when making decisions then the gut emotional reactions of those who know nothing about the educational landscape.
But to attempt to satiate you – I have a Masters in Education and have been a teacher and leader in both RPS and HCPS. By no longer being employed by RPS, I can, without fear of retribution (which was a real threat under previous administrations), speak openly about the challenges of the system. What I am actually doing to make a change is using my knowledge (from that thing rattling around in my head that has spent the last ten years immersed in education, curriculum, policy, leadership and diversity studies) researching and educating those who will listen so that decisions for the district are no longer made by vocal white and affluent parents who twist the system to meet their needs. My goal is to use my resources to help those who are not “education” people begin to understand the complex system that is education so that we can begin to unravel the problems that plague RPS and make sustainable changes…instead of the band-aids that have been places on gaping wounds for far too long. My goal is and has always been to reform the educational system so that it serves ALL students – specifically those who have been underserved and underrepresented in educational discussions.
I realize that white and/or affluent families will feel offended and their feelings will be hurt as they learn that their self aggrandizing has actually contributed to the problems…but do not take offense. There are things we can all do to improve the system. And yes, I have kids. No, they are not in RPS. I no longer live in the city. I moved to be closer to my mother and my grandmother (may she now rest in peace) who live just 2 miles away.
I’ve spent fifteen years watching what NCLB and ESEA have done to public education – disenfranchising teachers, stunting student learning and focusing all of schools’ energy on testing – and I have lost faith in the system. Therefore, I have fully opted out of all public education – both RPS and HCPS until I see a sustained vision for change that includes equitable policies and curriculum reform. And I choose to work from within the system to make those changes.
I also know my children well and understand their strengths and weaknesses. Traditional educational approaches would inevitably have labeled one of my children ADHD by now as traditional education is rarely well equipped to handle gifted students (yes, I’ve had him tested…) I’ve seen traditional education break the spirits of children like him and I believe that there are several educational philosophies and there is no one size fits all approach to education. Therefore, he is in a school that is equipped to handle his special needs. Additionally, the school my kids attend is diverse – both racially and economically -and this is important as I feel and stand behind the knowledge that children who grow up in diverse schools benefit from these experiences.
With this knowledge, though, comes responsibility, as I realize that not all families have the means or resources to advocate for their child’s needs or afford alternative options beyond traditional education.
This is why I have dedicated not only my personal time (through the research for these articles and my own personal growth), my professional time (as a teacher and leader in my school and district) and my educational career (my gifted studies, curriculum studies, educational leadership and policy studies) to finding ways to reform public education to better serve ALL children…not just those with the means to get what they want and not just those who “fit the mold.”
Now, I’m sure you will attempt to further attack me.
But..if you would like to have a real discussion about the article or the issues and research I have presented, without defaulting to personal attacks, I would be more than willing. Otherwise, we have nothing more to discuss.
Greg – Thank you for your comments. No, the “fix” is not as simple as rezoning to fully integrate those three schools.
Questions that arise from your comment – Why are middle class white parents “scared” of “sacrificing” their kids by sending them to Blackwell? Research continues to show that racial and economic integration benefits those kids who are furthest behind (usually lowest income) and does nothing to harm those who are more affluent. Additionally,as I stated above, parental perceptions about “good” and “bad” schools almost always have to do with the racial composition of a school and nothing to do with real indicators of success.
What I find a little concerning is that you believe the “success” of those schools has more to do with the white/affluent parents than the work of the teachers and administrations in the buildings. Also, I find it concerning that we talk about the success of those three schools, as most completely ignore that there are several schools who are more academically successful than any of those three. Carver, for example, has higher achievement rates while being predominately African American and low-SES. Yet, middle class parents are scared to send their kids there because it is a “bad” school while outperforming all three of the schools you mention above. If white and affluent parents actually cared about measures of success, it seems to me they would be flocking to Carver. Yet…they aren’t. Why?
And I would encourage you to read the work of Genevieve Siegel-Hawley, a VCU professor, and Tom Shields, a UR professor, who have both done extensive research about the harm enclave schools like Fox, Munford and Holton due to other schools.
The white families who stay in RPS aren’t “saving” us or “helping the district” as you suggest. They are creating enclaves that are self serving while ignoring the larger systemic issues that plague the system.
Data on pass rates…one indicator of success, and the one parents like to quote until it doesn’t tell the story they want to hear.
https://docs.google.com/spreadsheets/d/1Orhbh2uHd_U9lZS3FQ4P9NulGcIEMovEiN3gxOMYDr4/edit?usp=sharing