Chartsandgraphs: The Richmond Folk Festival
We’re just hours out from the start of the 2013 Richmond Folk Festival. Here are a handful of interesting/quasi-interesting chartsandgraphs to get you pumped and primed for folking.
Folk Festival attendance, in thousands, 2005-2012
The Folk Festival, which started as the National Folk Festival in 2005 and then switched to the Richmond Folk Festival in 2008, is Richmond’s largest festival. Last year it brought in 200,000 people over the weekend. That is many people.
Also of note: check out 2009’s dip in attendance due to a rainy Saturday (here’s this weekend’s forecast).
Equivalent percentage of Richmond’s 2012 population in attendance, 2006-2012
You know what else is many people? The population of Richmond proper: 208,833 souls according to Wikipedia. So what percentage of Richmond’s population is represented by Folk Festival attendance? Now, careful, don’t misinterpret this graph. It’s not the actual percentage of Richmonders that attend the Festival, it’s just a handy way to put the amount of people in context.
Number of volunteers, 2006-2012
Every year hundreds of volunteers sign up to lend the Folk Festival a helping hand in a bunch of different ways. The fest is absolutely massive and expensive so volunteers are very valuable, in fact you should sign up to volunteer today.
Donations collected by the Bucket Brigade, in thousands, 2006-2012
If you’ve been to the Folk Festival before you’ve seen those cheery folks asking for donations, a “drop in the bucket” (a literal, orange bucket). These fine volunteers have raised a big chunk of change over the years.
Cost of the 2012 Folk Festival$1.4M This is a lot of money. |
Total donated over seven years$455,800 This number is big too, but still way smaller than that other number. |
Three lines!, 2006-2012
This graph…I’m not even sure what’s going on here other than we’ve got three lines that cross each other at various points. Oh, watch out, they all have different scales too. Buyer beware!
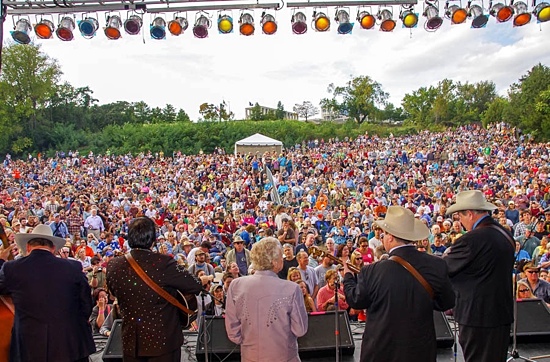
Photo courtesy of Richmond Folk Festival
-
Recommend this
on Facebook -

Report an error
-

Subscribe to our
Weekly Digest

Ross Catrow
Founder and publisher of RVANews.

There are 6 reader comments. Read them.