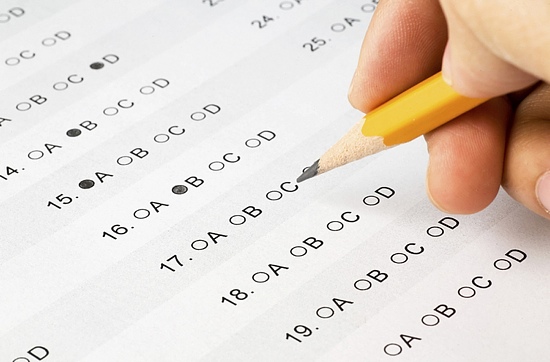
Virginia Department of Education releases SOL scores
Gains and losses for RPS, still behind county schools.

The state has released the scores from last year’s Standards of Learning tests. According to the RTD, Richmond schools showed gains but overall still compare poorly to neighboring county schools.
But overall, the city had scores below 70 percent on 22 of the 34 assessments.
Students in Chesterfield and Hanover passed the 70 percent mark in every category, and students in Henrico made it in 29 of the 34.
Richmond students had six of the seven double-digit gains in the area, plus the only double-digit loss. In addition to Algebra I and geometry, Richmond showed big gains in 4th and 5th grade math (up 12 points in each) and biology and chemistry (up 10 points in each).
But 6th grade math was down 11 points.
You can check individual school’s scores on the VDOE website but quite frankly this one on RTD is much easier to use.
RVA Opt Out is one local group that is urging parents and students to not take part in the SOL testing. They and other opt out groups feel that standarized testing is not an effective tool for gauging education.
Below is what happens when a student chooses to “Opt Out” according to the Virginia Department of Education.
The regulations do not provide for what is sometimes referred to as an “opt out policy” for students regarding the Virginia assessments. If, however, parents refuse to have their student participate in one or more of the required Virginia assessments, the following procedures should be followed within the school division:
- The parents should be informed that their student’s score report will reflect a score of “0” for any test that is refused.
- The school is strongly encouraged to request a written statement from parents indicating the specific test(s) the parents refuse to have their student complete. The document should be maintained in the student’s file as a record of the decision.
- To account for the student, a test record for the refused test(s) is to be submitted for scoring with a Testing Status 5 coded to indicate the refusal to take the test.
In situations where a student’s test attempt is coded with a Testing Status 5, the “0” score on the test is included in the school and division pass rates calculated for the purpose of state accountability and for performance in federal accountability. Because the student receives a “0” score for the refused test, the school and division participation rates for federal accountability are not affected.
So as a result in a class with 20 students if 5 opt out, the class will have full participation but 25% of those will receive a score of zero. Obviously these skews the results.
-
Recommend this
on Facebook -

Report an error
-

Subscribe to our
Weekly Digest


Notice: Comments that are not conducive to an interesting and thoughtful conversation may be removed at the editor’s discretion.
You will get at least one call reinforcing the policy. Do your homework and explain you understand the policies. An email will not suffice. They want a letter with a signature. Send your email, print it out, send it in and move one.
Be polite – your local teachers and staff don’t make these rules.
Do the right thing for your child. Stay focused on why you are making the decision to opt out and don’t let it get personal.
Also, this is much easier if your kid is not in HS and needs the sol pass for their HS diploma.
I was curious so I took a look at my son’s middle school SOLS scores. How should I read those numbers? For each subject and grade level tested his school had a pass rate in the 90s. Except for 7th Grade Mathematics which was in the 70’s. Does this mean I should be concerned about who is teaching 7th grade Math in the 7th grade at this school??
Aside from the fact that most math test scores around the state are down (Did you compare it to the overall district score?). You have several options (1) freak out over one number and assume that no one at the school can teach 7th grade math (highly unlikely) (2) realize that SOLs are one part of larger academic picture. (The whole child) (3) a low score could be due to many things that most parents aren’t aware of. That particular group could have been low in math to begin with, but you as the parent wouldn’t see the pre and post data to show that yes, that class made lots of growth but not quiet enough to do well on one particular test. Another reason could just be skewed data (did the school have opt outs?). The difference between 70 and 90 percent, based on overall school numbers, could really come down to 10 or 15 kids not passing. (it just depends, could be more). Demographics, resources, funding….the list of things that can affect a number is endless. If a particular teacher did not perform well, than administration would have intervened already, especially at a school where their other scores are in the 90s.
Look, at the end of the day you can choose to pick apart a report from one assessment that no one else in the country uses. (Most of the rest of the country now uses Common Core).
Or you can focus on your kid and their growth in all areas (academics, extracurriculars, just being a good kid). Watching grades, monitoring homework, being involved in the school are steps that you can take to ensure that your child is getting the most from public schooling. SOLs do not guarantee success in college or life.