Chartsandgraphs: What’s Richmond gotta do to get a drink around here?
If you like a drink now and then, which plenty of people do, it stands to reason that you like being able to get yourself to a drink easily and quickly. Here’s a chartsandgraphs picture of the geography of drinking in RVA. Bottoms up!

If you like a drink now and then, which plenty of people do, it stands to reason that you like being able to get yourself to a drink easily and quickly. You surely know where your favorite places are to get your hands on an alcoholic treat of your choosing, but we’re here today to put together the macro-level picture of the geography of drinking in metro Richmond. Bottoms up!
— ∮∮∮ —
% of metro population living with a 5-minute drive of an ABC license97.2% That’s 901,644 people in Chesterfield, Hanover, Henrico, and Richmond City–so, essentially, everybody. |
% of metro population living with a 5-minute walk of an ABC license43.6% The lower population densities in the suburbs show up here, with just 404,865 people in easy walking distance of a place to grab some brews. |
Being able to drive quickly to a place to grab some kind of retail booze is pretty much a foregone conclusion in greater Richmond’s four most populous localities. But drinking is an activity that pairs much better with traveling on foot than with operating several tons of complex machinery, so let’s talk about walking distance to licensed establishments.
The Virginia ABC has a huge variety of different license types available, but we want to know about the kinds that are issued to restaurants, bars, grocery stores, instead of special event licenses and other oddballs–living next door to a caterer’s office isn’t going to help you get a drink when you want one.
Retail licenses are grouped into one of six overall categories, by the type of beverage licensed for sale and whether the establishment can let you drink it there, take it home with you, or both. I slapped together block group data from the 2010 US Census and a 1500-foot radius of each licensee to figure out approximately what percentage of each locality’s population can get themselves to each kind of license in brisk five-minute walk.

Predictably, the city tops every category, but more people in the counties are pretty close to a license than you might expect intuitively. The state monopoly on off-premises liquor sales starts to show up in these numbers, as there are dramatically fewer Virginia ABC retail stores than there are convenience stores and grocery stores. Relatively few people in the metro area can take a quick stroll to grab a handle of bourbon, so if you’re among them, count yourself lucky.
— ∮∮∮ —
Richmond’s booziest neighborhoods
Richmond tops the chart across the board in easy alcohol access, and city drinkers love to compare notes and jockey in conversation over whose neighborhood has the most, best places to drink or buy a bottle of wine.
But this is not a place for subjective quibbles about the craft beer selection and cocktail program at your favorite local watering hole. It’s time to settle, once and for all, which Richmonders have the best access to the best variety of boozes, by the numbers only. To figure that out meant coming up with a relative scoring system which allows easy comparison among city neighborhoods. It meant inventing Drink Score.
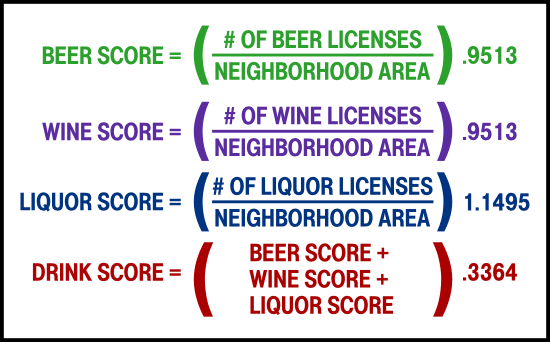
Here’s how it works: each neighborhood (as defined by the City of Richmond) gets scored on the total number of licenses of each type either within its borders or within a 200 foot radius thereof, a buffer that’s needed since so many neighborhood lines are drawn along major streets and it seems unfair not to give both Scott’s Addition and the Museum District credit for the 7-11 at Boulevard and Broad. That number’s divided by the neighborhood’s area in square miles to get an idea of the density of each license type, and then fit to a 0-100 scale to allow meaningful comparison between neighborhoods. The final Drink Score is an aggregate of the three numbers, giving credit for number and variety of license types and density of spots.
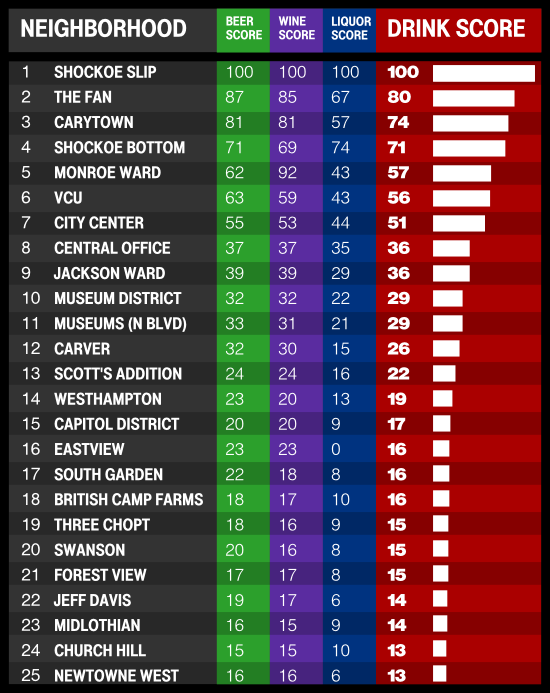
The results are pretty much what you’d expect: the bustling Shockoe Slip district, with its blocks of Cary Street riddled with drinking establishments of every kind and variety, tops every category possible. Though much larger in area, the volume and diversity of licensed shops, restaurants, and bars within the Fan District puts it in close second place.
Here’s a Google Fusion Table of all neighborhoods and scores.
With all the attention paid to so-called “food deserts” recently, defined as places where easy access to good grocery stores is limited, it’s worth noting that a substantial proportion of Richmond’s people live in Booze Deserts, forced to travel outside the confines of their immediate neighborhood just to get a drink. Most of these are concentrated in the more suburban southern expanses of the city.
To break down the disparity, there are 35.7 licenses per square mile north of the James River (Drink Score 9), compared to 14.3 licenses per square mile (Drink Score 3) on the opposite end of the bridges. In other words, the booze density north of the James is 1.5 times that on the Southside.
% of Richmonders living in a top-25 drink score ‘hood36.4% 74,260 people make their homes in neighborhoods which are more drinker-friendly than the plurality of the city’s land area. |
% of Richmonders living in booze deserts22.5% That’s 45,906 citizens living in neighborhoods which have no licenses either within them or near them. |
Map of Richmond neighborhood drink scores and ABC licenses
And here’s all the places you can go to either sit and have a drink or snag some hooch to take home in the Richmond area:
Some distinctive drinking corridors and clusters are clear on the map. Licensees hug major arterial routes in the suburbs, and within the city’s denser areas are clustered tightly in neighborhoods known as drinking destinations.
— ∮∮∮ —
Data sources and credits
License data from the Virginia Department of Alcoholic Beverage Control (February 2013), including only licenses with “Active” status and with the locations of all Virginia ABC retail stores in Chesterfield, Hanover, Henrico, and Richmond City added to the data set and the whole package subsetted to include those most likely to be consumer-facing and open to the public. Data available in a public Google Fusion Table, though this is just for funsies and you should download a fresh copy from VA ABC and subset it yourself if you need to do any serious analysis.
Population data is from the United States Census Bureau 2010 Population & Housing Unit Counts — Blocks. Neighborhood boundaries from the City of Richmond GIS.
-
Recommend this
on Facebook -

Report an error
-

Subscribe to our
Weekly Digest

Taber Bain
Taber Andrew Bain would like to know your happy hour specials. He
lives in Jackson Ward.

Notice: Comments that are not conducive to an interesting and thoughtful conversation may be removed at the editor’s discretion.
Wow, can we get Taber into the VCU Urban Planning program please? Chip him off a few bucks so that he can put a degree behind his hobby. Great work, very jealous of this fine work.
Very impressive. I know a few urban geographers that would be interested in this, too.
As a fellow data geek, I have to say this is freaking amazing. A toast to Taber!
Brilliant, sir. Well researched, and a topic that’s near and dear to your heart!
Indeed brilliant and inspiring. But, no one really lives in the Slip.. so we win!
Way to go Fan. I know i moved there for a better reason than just better neighbors.
This is impressive research and presentation. Good to know! It’s also good to know that there is a Wawa in the middle of the Swift Creek reservoir. I’ll have to hit that up the next time I’m out in my canoe. Seriously though, this is awesome!
Speaking as someone who lived in the Slip for 2+ years…nobody lives in the Slip.
@Morgan Haha, thanks for the heads up, automated geocoding of addresses can yield some surprises! I’ve gotten Wawa #657 resituated in its proper home.
I’ve got a methodology issue here. Proximity to high score neighborhoods should be reflected in the score of adjacent neighborhoods.
City Stadium (or “Stadium”) neighborhood has an Drink Score of 0. It is, however, right next to Carytown – an easy, safe 3 or 4 block walk.
@John That’s totally a factor I’d love to get wrapped in! Something more akin to a heatmap/heatmap-type process which actually accounted for distance needed to travel along actual public rights-of-way with a little network analysis jiu-jitsu would be a lot more useful for knowing about the ease of access to licensees for individual census blocks.
I decided here to go with “what’s IN your neighborhood?” as the metric rather than “what’s easy to get to from your neighborhood?,” but I’d absolutely love to see the latter too!